A website can be slow even though its server answers a ping. A server can also reject ping traffic while its HTTPS service works normally. Choosing the right network check helps you understand exactly which part of a connection has been observed.
MetriBeacon offers ping and TCP checks alongside its application and certificate checks. This guide explains when to use each one, how to choose a useful target and how to investigate different results from different locations.
Begin with the condition you actually need
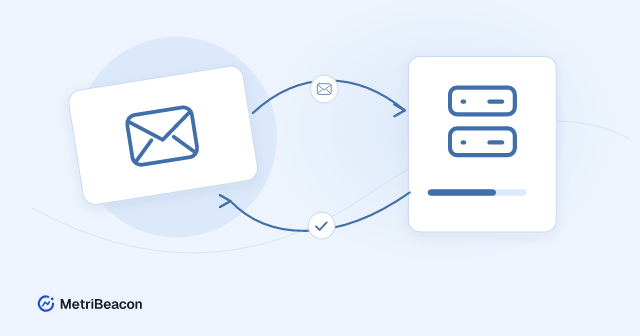
A ping check observes whether the target responds to the supported ICMP probe. It can help you follow reachability and network timing, but an unanswered probe may also reflect a firewall or a host policy that does not permit ICMP.
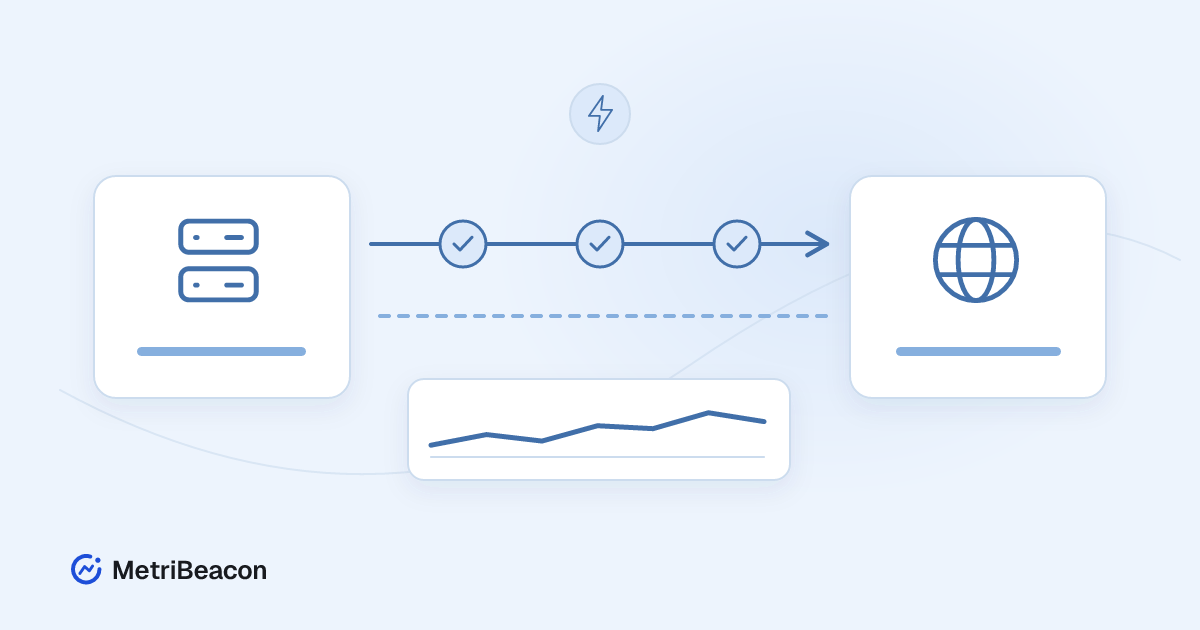
A TCP check attempts a connection to a particular host and port. It tells you about that connection attempt, not whether the application behind the port returned meaningful content. A completed TCP connection to port 443 does not by itself confirm a valid certificate or a working checkout page.
| Question | Useful starting point |
|---|---|
| Does the host answer the configured network probe? | Ping |
| Can a connection be established to this service port? | TCP |
| Does the website return the expected status or content? | HTTP or HTTPS |
| Is the certificate valid for the intended service? | TLS certificate check |
Combine observations when they answer different operational questions. Avoid adding several identical checks merely because they have different names.
Choose a target that the selected location can reach
Use a hostname or address that you operate or are authorised to monitor. For TCP, specify the actual service port. Ports such as 22 and 443 are common conventions, but the correct value is the one configured for your service.
Central public check locations require permitted public targets and the relevant protocol capability. A private address reachable from your office is not automatically reachable from a public location. Private monitoring requires an explicitly supported local setup and its permitted network scope.
Check how the hostname resolves as well as which service you intend to test. A load-balanced name may lead to several addresses. An address result and a service result can therefore need separate interpretation. The network check documentation explains the available target and protocol settings.
Create the monitor and inspect its first result
Choose Add monitor, open Network & certificates and select the appropriate ping or TCP check. Fill in the target and protocol fields. Give the monitor a name that includes its purpose, rather than only the hostname.
Select available locations, the interval, confirmation settings and the measurements you need. The available choices depend on the protocol capabilities and your workspace's allowances. Review the configuration before saving.
After saving, open the monitor overview and inspect the first confirmed result. Check its location, observation time and reported condition. A saved configuration alone is not proof that a check has run successfully.
Use the explicit test action when you want to examine the current configuration. It is a diagnostic observation; it should not be treated as a replacement for the monitor's ongoing results or historical availability.
Compare locations without jumping to a cause
A successful result from one region and a failure from another can indicate differences in routing, filtering, name resolution or the target addresses involved. It can also involve missing or delayed observations. Start with the actual result details instead of assigning a cause from geography alone.
Read the location policy and confirmation settings that apply to the monitor. They determine how individual observations contribute to its state. An unknown or stale observation is not a confirmed success, and one delayed location does not prove that the application has failed everywhere.
Self-check protection is another case to recognise. If a check location runs on the server being tested, a protected test can be blocked rather than reported as a normal target failure. Read the explanation for that location and compare independent observations.
Keep timeouts and intervals meaningful
An interval controls how often the monitor is expected to check. A timeout limits how long an individual attempt can take. Shortening either value changes what you observe and the amount of checking performed; it does not repair a slow network path.
Choose settings that fit the service and the action you would take. A management port may need a different monitoring rhythm from a customer-facing website. Do not select the smallest number solely to make the interface appear more responsive.
When investigating latency, compare the same protocol and a consistent time range. Ping timing and a full HTTPS response measure different work. Their values can both be correct without being directly interchangeable.
Connect network observations to application monitoring
For a web service, keep an HTTP or API monitor that checks an appropriate response. A TCP monitor can provide additional connection evidence, while server monitoring helps inspect CPU, memory and storage on the underlying host.
For example, a healthy TCP connection with a failing HTTP content check directs attention toward the application response. A connection failure seen at several independent locations warrants a different investigation. These combinations help narrow the search, but they do not establish a root cause on their own.
Group the related monitors into a service view so that you can move between the observations without losing their context. Keep their individual meanings clear in the names and descriptions.
Verify the alarm and the recovery path
Enable an appropriate alarm deliberately, choose its notification target and review the confirmation behaviour. Check the incident evidence and delivery history when a warning appears. A missing observation should not be converted into an invented healthy result to make an alert disappear.
After a change to the service or firewall, review fresh results from the configured locations and the current application response. Confirming recovery with the same condition that detected the problem makes the result easier to trust.
Begin with one permitted target and one operational question. Add a second protocol only when it provides another useful piece of evidence. You can create a MetriBeacon account and choose the relevant network check from the monitor selection; the website/API template below creates an application check separately.