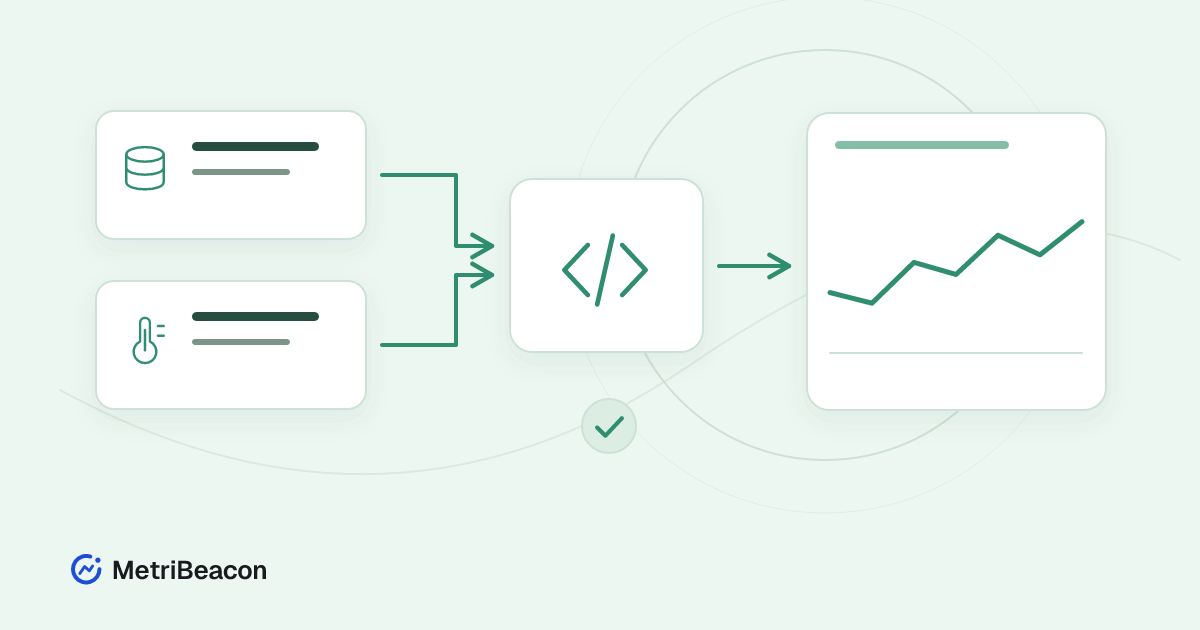
A used-memory reading is easier to judge alongside the available memory. An accumulating byte counter becomes more useful when you can see a transfer rate. Calculated series in MetriBeacon let you turn existing numeric measurements into another measurement with a defined meaning.
This guide walks through source selection, a practical percentage formula and the differences between gauge values and counters. It also explains why a missing source should remain a gap rather than become an invented zero.
Decide what the result should mean
Write down the question before building the formula. You might need the combined load of two comparable sources, the used share of a capacity or the rate of change of a counter. Give the result a name that describes that question and its unit.
A calculated series uses existing numeric source series from the same workspace. It does not collect another sensor reading or install another agent. Its usefulness depends on the meaning, freshness and units of the sources you select.
Review the measurement model if you are unsure whether a source is a gauge or a counter. That distinction determines which calculation is appropriate.
Select sources and assign clear aliases
Open a suitable data monitor, select its Series tab and choose Add calculated series. Name the result, choose the source series and give each source an alias that you can recognise in the expression.
For a memory-share calculation, aliases such as used and total make the relationship clearer than a long string of unrelated names. Check the monitor and unit shown for each source. Two similarly named measurements are not necessarily the same kind of observation.
You can use up to eight numeric sources in one formula. Start with fewer where possible. All sources must belong to the workspace and be accessible to you; a source selection cannot grant access to another workspace's data.
Build a percentage from comparable values
Suppose used and total are memory measurements with matching units. The following expression calculates a percentage from their minute averages:
100 * mean(used) / mean(total)
If the source averages are 6 GiB used and 8 GiB total, the numeric result is 75. The multiplication by 100 gives the ratio a percentage scale. It does not make unrelated units compatible.
This example is a ratio of the two minute averages. It is not a promise that every individual sample during the minute was exactly 75 percent. Choose sources whose collection rhythm and meaning suit that calculation, and inspect the underlying measurements when the result looks surprising.
The editor also offers common formula presets. Check the inserted expression and aliases before saving; a preset cannot determine whether two sources describe the same real-world quantity.
Choose functions to match the source
Functions describe how source observations contribute to the result. Use them deliberately rather than treating every number as an instantaneous reading.
| Function | Meaning |
|---|---|
mean(a) |
Mean of the available numeric observations in the calculation window |
last(a) |
Latest value in the window |
min(a) or max(a) |
Lowest or highest value in the window |
increase(a) |
Increase of a counter over the supported window |
rate(a) |
Counter increase expressed per second |
increase and rate require a counter source. For an accumulating byte count, rate(bytes) can express bytes per second. Applying a rate to a gauge such as temperature does not turn it into a valid counter calculation.
Addition and subtraction require compatible dimensions and units. Adding bytes to milliseconds has no useful meaning. Review the numeric data guide and fix the source selection instead of merely changing a label to make incompatible data look comparable.
Allow a completed minute for the first result
Calculated series are evaluated for completed UTC minutes. They do not produce a new independent result for every second that a source sends a reading. After creating a formula, allow a full calculation window to close and inspect the result and any waiting indication.
The result is another numeric series that you can use in an appropriate chart or dashboard. Read it with the selected time range and the source data in mind. A large historical window may show aggregated values rather than every original minute result.
Calculated results also use the relevant series and data allowances. Review usage when creating many formulas or combining them into further calculations. A formula is a useful measurement, not a way to avoid resource limits.
Investigate gaps instead of replacing them with zero
A source may be missing, stale, paused or no longer available. A counter may lack a complete transition for the window. Division by zero and non-finite results also cannot provide a valid number. In these cases the appropriate result is a gap.
Open the calculated series and inspect its status and source measurements. A waiting indication can distinguish missing sources from a processing or capacity problem. The guide to live values and gaps helps separate contact with a monitor from fresh measurements.
Do not interpret a missing value as an empty memory allocation, zero traffic or a healthy system. If the source has been removed, choose a valid replacement deliberately and review what that change means for the result.
Change a formula without rewriting the past silently
An edited formula takes effect from the following minute. Previously calculated history retains the meaning of the version that produced it. A change to the expression does not automatically recalculate every older value.
If needed, use Recalculate recent history for a supported period of up to 24 hours. Available source history and retention still apply. Check the selected starting point and the scope before saving the request.
Recalculation is useful for a recent correction, but it is not a reconstruction of data that was never recorded. Historical corrections also do not automatically turn into a new sequence of historical alarm notifications.
Begin with one result you can check manually
Create a simple formula and calculate a few expected values yourself. Compare them with the source measurements in the same window. Check normal input, a zero denominator where relevant and a missing-source case before depending on the result.
Once the result is understandable, add it to a chart or dashboard and consider an appropriate numeric alarm. You can create a MetriBeacon account, connect your own numeric measurements and start with one clearly named calculated series.